What Monte Carlo Simulation Actually Is — And Why It Beats Your Spreadsheet
A spreadsheet gives you one number. That number is wrong. Here’s what Monte Carlo actually does — and why probability distributions beat point estimates.
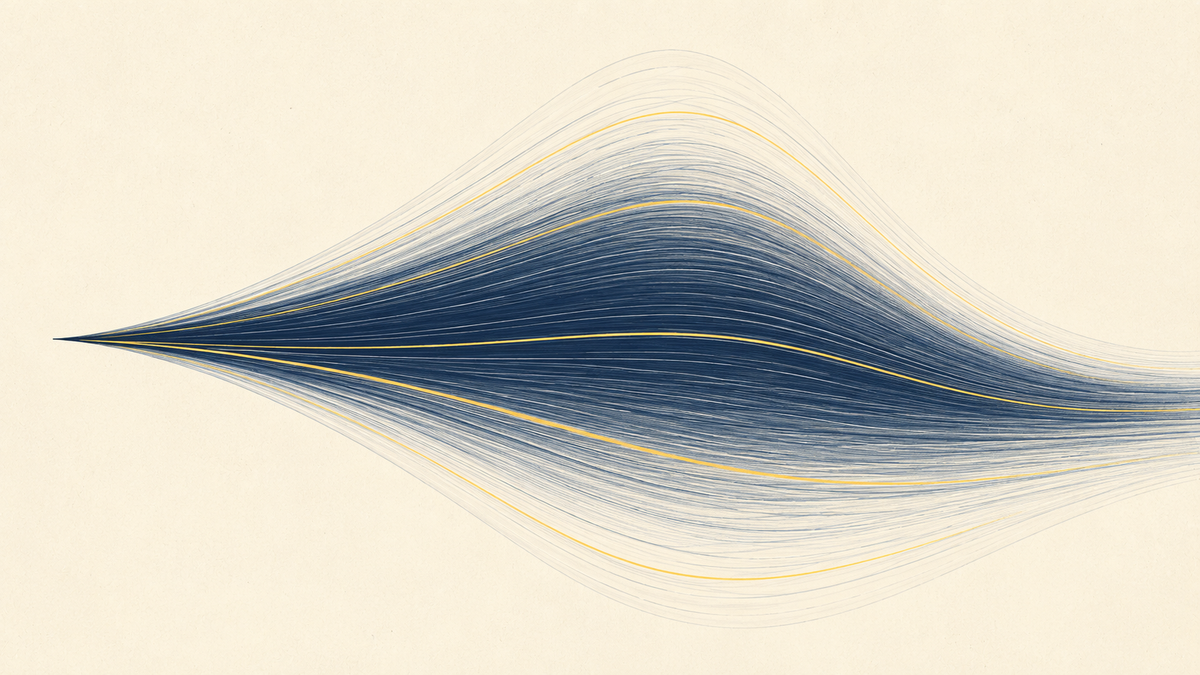
You’re thinking about leaving your job. You open a spreadsheet. You put in your current salary, a projected new salary, some rough assumptions about career growth. You do the math.
The spreadsheet gives you one number.
That number is wrong. Not because you made an arithmetic error — because a single number is the wrong thing to calculate. Real life doesn’t happen at a single point. It happens across a range of possibilities. The spreadsheet assumes a future; Monte Carlo simulation explores a thousand of them.
Here’s what Monte Carlo actually is, why it was invented, and why it’s a better tool for decisions where uncertainty is the whole point.
The core idea is simple
Monte Carlo simulation is a technique for estimating outcomes when inputs are uncertain. Instead of plugging in one value for each variable, you specify a range — and the system samples randomly across that range, thousands of times, building up a picture of what outcomes are actually possible and how likely each one is.
The name comes from the casino in Monaco, and the analogy is intentional: when you don’t know exactly what will happen, you run the experiment many times and look at the distribution of results.
It was developed during World War II by mathematicians at Los Alamos — John von Neumann and Stanislaw Ulam — to model neutron diffusion in nuclear reactions. The physics were too complex for closed-form equations, so they ran statistical experiments instead. Today the same principle runs retirement planners, engineering risk models, drug trial simulations, and the decision engine inside LifeOdds.
What your spreadsheet is actually doing
A standard spreadsheet model does something quietly dangerous: it converts every uncertain input into a point estimate.
You type in “let’s say salary grows at 3% per year.” You type “let’s say the new job has a 70% chance of working out.” You pick one number for each variable and the model marches forward from there, producing one answer.
The problem isn’t that you chose the wrong estimates. The problem is that you’ve hidden all the uncertainty inside the assumptions. The model looks precise. It produces an exact figure. But that precision is an illusion — a false confidence that comes from treating unknowns as if they were known.
A Monte Carlo model does the opposite. It makes the uncertainty explicit and then explores it systematically.
What “running 1,000 simulations” actually means
Take the job decision again. You’re uncertain about:
- How much the new role actually pays after negotiation
- How long you stay before the next move
- Whether your current role’s career ceiling matters as much as you think
- What the economy looks like in three years
In a Monte Carlo model, each of those uncertainties is represented as a distribution. Instead of “salary grows at 3%,” you might specify “salary grows somewhere between 1% and 6%, most likely around 3%.” Then the simulation draws a random value from that distribution for each variable, runs the model with those values, and records the output. Then it does that 999 more times.
The result isn’t one number. It’s a distribution of numbers — a histogram showing all the places your outcome could land and how frequently the model ends up there.
From that distribution, you can read off things like: “There’s a 74% chance the new job puts me ahead financially within three years. There’s a 15% chance it puts me behind. The best-case upside is roughly twice the worst-case downside.”
That’s qualitatively different information from “the new job should pay off.” It gives you something to actually reason with.
What Monte Carlo tells you that a spreadsheet can’t
Probabilities, not predictions
A spreadsheet predicts. Monte Carlo estimates probabilities. For most decisions under uncertainty, probabilities are what you actually need. “What are the odds this works out?” is a better question than “what will happen?”
The shape of the risk
Monte Carlo results show you whether your risk is symmetric or skewed. If the distribution has a long left tail, you have more downside risk than a point estimate would suggest. If it’s right-skewed, the upside is open-ended. The shape matters as much as the average.
What’s actually driving the outcome
When you run Monte Carlo through a model with multiple uncertain inputs, you can measure which variables are contributing most to the spread in outcomes. For career decisions, the equivalent might be: tenure at the new role matters far more than the exact starting salary.
Tail events
A spreadsheet set to “base case” assumptions will never show you a bad outcome unless you deliberately create a pessimistic scenario. Monte Carlo samples across the full distribution, which means low-probability but high-impact outcomes appear in the results. That’s where you learn whether the downside is survivable.
The simulation is only as good as the inputs
Monte Carlo has one honest limitation: garbage in, garbage out. If you specify the wrong distributions — too narrow, too optimistic, missing key correlations — the simulation will confidently explore the wrong space.
This is less a flaw of the technique and more a feature, because it forces you to be explicit about your assumptions. With a spreadsheet, you can bury an optimistic assumption inside a single cell and never examine it. With Monte Carlo, you have to define the full shape of your uncertainty, which usually reveals assumptions you hadn’t noticed you were making.
Why it matters for life decisions specifically
Finance and engineering use Monte Carlo because their models are complex and the stakes justify the rigor. But the same logic applies to any decision where the future is genuinely uncertain — which is most decisions worth making.
When you’re choosing between a stable job and a riskier opportunity, between staying and leaving, between a known path and an unknown one, the question is never “what is the most likely outcome?” It’s “given everything I don’t know, what are the real odds of each outcome, and what does the distribution of possibilities look like?”
A spreadsheet gives you a number. A Monte Carlo simulation gives you a map.
LifeOdds runs 1,000 simulations of your specific decision — income trajectories, uncertainty ranges, time horizon — and shows you the full probability distribution. Not a single prediction, but a picture of what’s actually possible: the median, the upside, the downside, and the odds of each.
That’s the difference between a guess dressed up in formulas and an actual probabilistic answer to the question you’re asking.